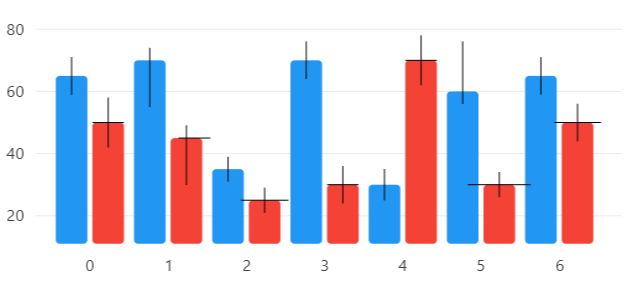
Error Bars
This web site builds the control from code behind but you could also grab it from the toolbox, this sample also uses a ViewModel to populate the properties of the control(s) in this sample.
View model
using CommunityToolkit.Mvvm.ComponentModel;
using LiveChartsCore;
using LiveChartsCore.Defaults;
using LiveChartsCore.SkiaSharpView;
using LiveChartsCore.SkiaSharpView.Painting;
using SkiaSharp;

namespace ViewModelsSamples.Error.Basic;

public partial class ViewModel : ObservableObject
{
    public ISeries[] Series { get; set; } =
    {
        // use the ErrorValue type to define the error in Y
        new ColumnSeries<ErrorValue>
        {
            Values = new ErrorValue[]
            {
                // (Y, Y+- error) // mark
                new(65, 6),
                // (Y, Y+ error, Y- error) // mark
                new(70, 15, 4),
                new(35, 4),
                new(70, 6),
                new(30, 5),
                new(60, 4, 16),
                new(65, 6)
            },
            ErrorPaint = new SolidColorPaint(SKColors.Black)
        },

        // When you need to define the error in X and Y use the ErrorPoint type // mark
        new ColumnSeries<ErrorPoint>
        {
            Values = new ErrorPoint[]
            {
                // (X, Y, Y+- error, Y+- error) // mark
                new(0, 50, 0.2, 8),
                // (X, Y, X- error, X+ erorr, Y+ error, Y- error) // mark
                new(1, 45, 0.1, 0.3, 15, 4),
                new(2, 25, 0.3, 4),
                new(3, 30, 0.2, 6),
                new(4, 70, 0.2, 8),
                new(5, 30, 0.4, 4),
                new(6, 50, 0.3, 6)
            },
            ErrorPaint = new SolidColorPaint(SKColors.Black)
        }

        // Error marks are also supported in LineSeries<T> and RowSeries<T> // mark
    };
}
Form code behind
using System.Windows.Forms;
using LiveChartsCore.SkiaSharpView.WinForms;
using ViewModelsSamples.Error.Basic;

namespace WinFormsSample.Error.Basic;

public partial class View : UserControl
{
    /// <summary>
    /// Initializes a new instance of the <see cref="View"/> class.
    /// </summary>
    public View()
    {
        InitializeComponent();
        Size = new System.Drawing.Size(50, 50);

        var viewModel = new ViewModel();

        var cartesianChart = new CartesianChart
        {
            Series = viewModel.Series,

            // out of livecharts properties...
            Location = new System.Drawing.Point(0, 0),
            Size = new System.Drawing.Size(50, 50),
            Anchor = AnchorStyles.Left | AnchorStyles.Right | AnchorStyles.Top | AnchorStyles.Bottom
        };

        Controls.Add(cartesianChart);
    }
}
Articles you might also find useful:
Error bard in line series
In the previous sample you can replace the ColumnSeries<ErrorValue> with LineSeries<ErrorValue> to create
a line chart with error bars:
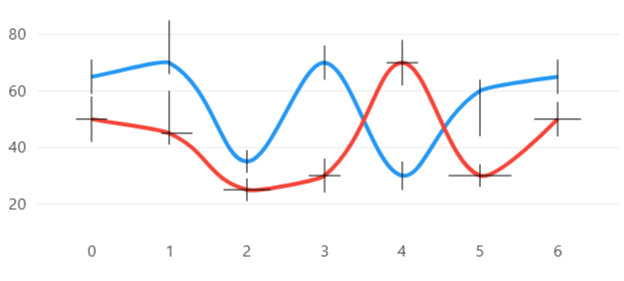
In the previous image, the Fill, GeometryFill and GeometryStroke properties are null.