Specify Both X And Y
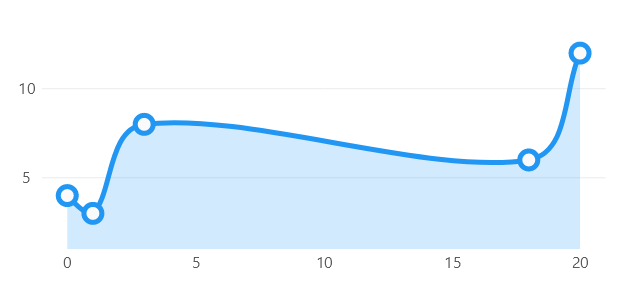
When you need to specify both, X and Y coordinates, you can use the
ObservablePoint class.
In other examples in this repository you will notice that the library can also plot primitive types such as
int or double. The library (usually) uses the index of the element in the array as the X coordinate
and the value as the Y coordinate, so even though we are passing an array of primitives, the library is mapping
that object to an (X, Y) point. The library can build charts from any object, but we must teach LiveCharts
how to handle that object. If you want to learn more, please read the
Mappers article.
Code behind
using Eto.Forms;
using LiveChartsCore;
using LiveChartsCore.Defaults;
using LiveChartsCore.SkiaSharpView;
using LiveChartsCore.SkiaSharpView.Eto;

namespace EtoFormsSample.Lines.XY;

public class View : Panel
{
    public View()
    {
        var values = new ObservablePoint[]
        {
            new(0, 4),
            new(1, 3),
            new(3, 8),
            new(18, 6),
            new(20, 12)
        };

        var series = new ISeries[]
        {
            new LineSeries<ObservablePoint>
            {
                Values = values
            }
        };

        var cartesianChart = new CartesianChart
        {
            Series = series
        };

        Content = cartesianChart;
    }
}
Related articles:
~/samples/lines/xy/template.md