Line Geometries
MyGeometry.cs
using LiveChartsCore.Drawing; using LiveChartsCore.SkiaSharpView.Drawing;
namespace ViewModelsSamples.Lines.Custom;
public class MyGeometry : BoundedDrawnGeometry, IDrawnElement
    canvas.DrawRect(X, Y, Width, Height, paint);
    canvas.DrawLine(X, Y, X + Width, Y + Height, paint);
    canvas.DrawLine(X + Width, Y, X, Y + Height, paint);
}
}
Code behind```
using Eto.Forms; using LiveChartsCore; using LiveChartsCore.SkiaSharpView; using LiveChartsCore.SkiaSharpView.Drawing.Geometries; using LiveChartsCore.SkiaSharpView.Eto; using ViewModelsSamples.Lines.Custom; using LiveChartsCore.Drawing;
namespace EtoFormsSample.Lines.Custom;
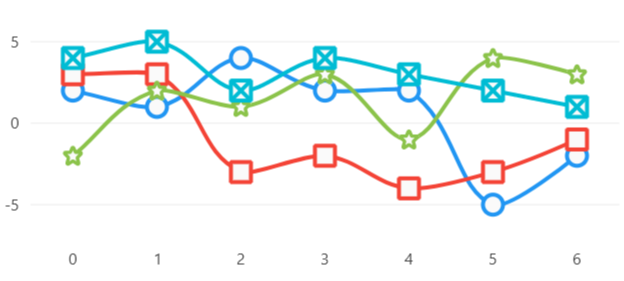
public class View : Panel { public View() { var values1 = new double[] { 2, 1, 4, 2, 2, -5, -2 }; var values2 = new double[] { 3, 3, -3, -2, -4, -3, -1 }; var values3 = new double[] { -2, 2, 1, 3, -1, 4, 3 }; var values4 = new double[] { 4, 5, 2, 4, 3, 2, 1 }; var pinPath = SVGPoints.Pin;
    var series = new ISeries[]
    {
        new LineSeries<double>
        {
            Values = values1,
            Fill = null,
            GeometrySize = 20
        },
        new LineSeries<double, StarGeometry>
        {
            Values = values2,
            Fill = null,
            GeometrySize = 20
        },
        new LineSeries<double, VariableSVGPathGeometry>
        {
            Values = values3,
            Fill = null,
            GeometrySize = 20,
            GeometrySvg = pinPath
        },
        new LineSeries<double, MyGeometry>
        {
            Values = values4,
            Fill = null,
            GeometrySize = 20
        }
    };

    var cartesianChart = new CartesianChart
    {
        Series = series
    };

    Content = cartesianChart;
}
}
<!--
To get help on editing this file, see https://github.com/beto-rodriguez/LiveCharts2/blob/dev/docs/readme.md
content is normally pulled from the examples in the repository.
-->


<span style="opacity: 0.7"> Related articles: </span>


<div>
    <a href="https://livecharts.dev/docs/eto/2.0.0/CartesianChart.Cartesian%20chart%20control">
        <b>- Cartesian chart control</b>
    </a>
</div>

<div>
    <a href="https://livecharts.dev/docs/eto/2.0.0/CartesianChart.Line%20Series%20properties">
        <b>- Line series properties</b>
    </a>
</div>


<div id="edit-this-article-source">
    ~/samples/lines/custom/template.md
</div>